

Life Expectancy 2022-2024
Life Expectancy for Local Authorities, 2022-2024
The Office for National Statistics (ONS) has published the latest national and subnational life expectancy estimates for the UK, covering the three-year period 2022 to 2024. These publications show period life expectancy, which is the average number of years someone will live beyond their current age based on mortality rates during the period.
Bedford Borough
The latest ONS figures for 2022–2024 show continued improvement in life expectancy for both males and females in Bedford Borough when compared with the previous years (chart 1).
Chart 1: Life Expectancy male v female, 2010 to 2024
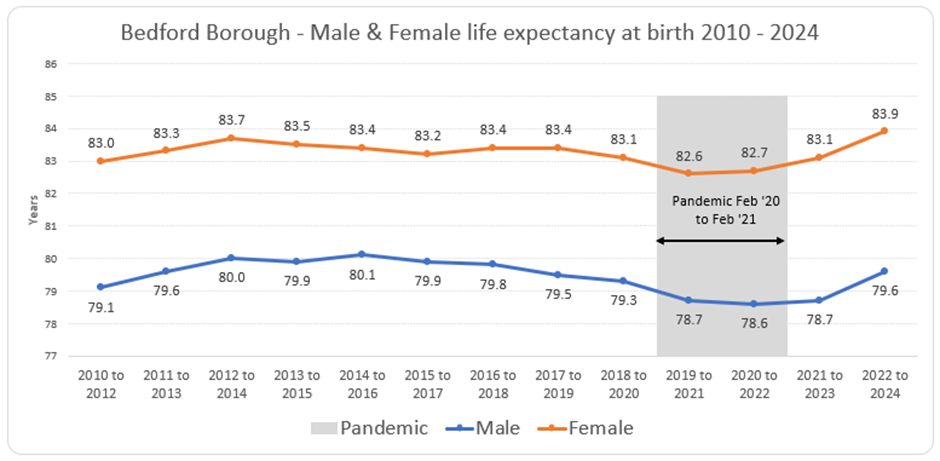
Source: Life expectancy for local areas of the UK – Office for National Statistics
Observations:
Life expectancy has improved for both males and females in 2022-2024 compared with the previous three-year period (2021-2023).
- Males LE: +0.9 years, rising from 78.7 to 79.6
- Females LE: +0.8 years, rising from 83.1 to 83.9
Improvement is stronger than the equivalent national increases, suggesting Bedford Borough is recovering slightly faster than England as a whole.
Table 1. Bedford Borough life expectancy compared to England
| Sex | 2021-2023 (Eng) | 2022-2024 (Eng) | Change (Eng) |
| Male | 78.7 (79.1) | 79.60.6 (79.5) | +0.9 (+0.4) |
| Female | 83.1 (83.1) | 83.9 (83.3) | +0.8 (+0.2) |
Gender gap:
- 2021–2023: 83.1 – 78.7 = 4.4 years
- 2022–2024: 83.9 – 79.6 = 4.3 years
Slight decrease in the male–female gap, indicating a minor narrowing.
Impact of COVID‑19:
Chart 1 illustrated the effect of the COVID-19 pandemic with a visual drop for both sexes, highlighting the local impact of increased mortality.
- Life expectancy dipped in the 2019–2021 and 2020–2022 periods due to the pandemic.
- The 2022–2024 figures show a recovery toward pre-pandemic levels, although male life expectancy has not fully returned to its 2014–2016 peak (~80.1 years).
Post-pandemic – return to normal:
- Both sexes are showing upward trends, indicating partial recovery.
- Females appear slightly above pre-pandemic levels, while males are still catching up.
Long-term perspective:
- Females have not only recovered but have reached their highest point in the 14-year series (83.9).
- Males are improving but remain on a more gradual trajectory compared with the sharper pre-2014 rise.
Summary:
Bedford Borough has seen improvements in life expectancy for both males and females in 2022–2024. The male–female gap has slightly narrowed, and the impact of COVID-19 is diminishing, but male life expectancy has not fully returned to pre-pandemic highs yet.
- Life expectancy for local areas of the UK: between 2001-2003 and 2022-2024. Available at: https://www.ons.gov.uk/peoplepopulationandcommunity/healthandsocialcare/healthandlifeexpectancies/bulletins/lifeexpectancyforlocalareasoftheuk/between2001to2003and2022to2024
- Life expectancy at birth and at age 65 years by sex across local areas in the United Kingdom, between 2001 to 2003 and 2022 to 2024. Available at: https://www.ons.gov.uk/visualisations/dvc3435/fig02/index.html