Skip to content
BMKJSNA Logo
Bedford  BoroughCentral BedsCentral BedfordshireMilton KeynesMilton Keynes City
Logo
Home
JSNA
OverviewPopulation & PlaceChildren & Young PeopleLiving & Working WellAgeing WellSpecific Vulnerabilities
DashboardsCensus 2021
Reports
Director of Public Health ReportsHealth Needs AssessmentsPharmaceutical Needs Assessment
More
Data LibraryPlace LevelLocal InsightAdditional ResourcesFeedback Form
Login  Search
  •   Home
  • Joint Strategic Needs Assessment
  • Population & Place
  • Demographics Dashboard
  • Overview
  • Population & Place
  • Children & Young People
  • Living & Working Well
  • Ageing Well
  • Specific Vulnerabilities

JSNA Sections

  • Overview
  • Population & Place
  • Children & Young People
  • Living & Working Well
  • Ageing Well
  • Specific Vulnerabilities

In This Section...

  • Population & Place
  • Population Forecasts 2023–2043
  • Demographics Dashboard
  • Indices of Deprivation 2025
  • Life Expectancy 2022-2024
  • Inequalities in health perception

Demographics Dashboard

Demographics Dashboard

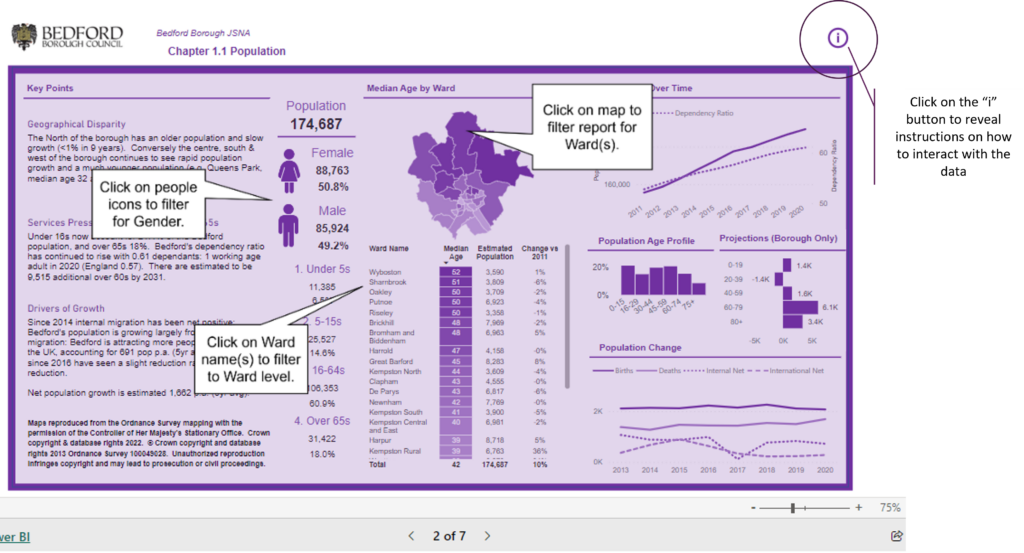
The dashboard features information that provides insight into the make-up of the population of Bedford Borough, including: age and sex; ethnicity; life expectancy, healthy life expectancy and population density. Data is accurate as of April 2025.

Format: This is a Power BI dashboard, which enables you to interrogate the data and charts according to your needs. See instructions below for how to get started.

How to use the Dashboard

This Dashboard is delivered in an interactive Power BI report that will enable you to interrogate the data and charts according to your needs. You can:

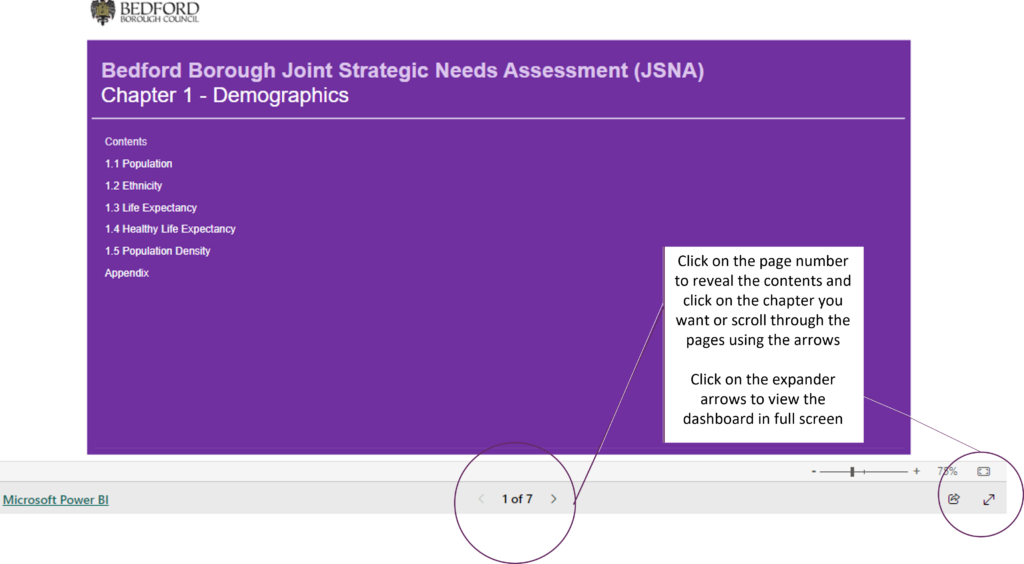
  • Navigate around the pages in the Dashboard by clicking on the page number at the bottom of the screen, which reveals the page menu or by clicking on the arrows
  • Display the Dashboard in full screen mode by clicking the expansion arrows in the bottom right corner
An image showing an example of the demographics dashboard.
  • Identify which elements you can manipulate by clicking on the i button in the top right corner
An image showing an example of the demographics dashboard.

Please note: The National and Borough data reflect the 2021 Census. Ward level data from the 2021 Census is not yet available and therefore these profiles use the 2011 Census estimates. This means the sum of wards does not equal the Borough total. These profiles will be updated as and when the data becomes available.

Bedford Borough Council
DataPress Data Catalogue
  • Accessibility
  • Privacy & Cookies
  • Feedback
  • Copyright © 2026
  • Bedford Borough Council