

Inequalities in health perception
Inequalities in health perception
Background
Healthy life expectancy (reported in the Demographics Dashboard) is a summary measure of how long and well people live, which provides important context for population health strategies. It is calculated through a combination of mortality rates and the proportion of people self-reporting good health taken from the Annual Population Survey. Respondents to the survey are asked to rate their health from very good to very bad. The same question was included in the 2021 Census and therefore responses to this provide a once-in-a decade-opportunity to understand disparities in how people perceive their health between groups with different characteristics. Analysis of the data also provides insight into the reasons behind healthy life expectancy inequalities.
Age matters most
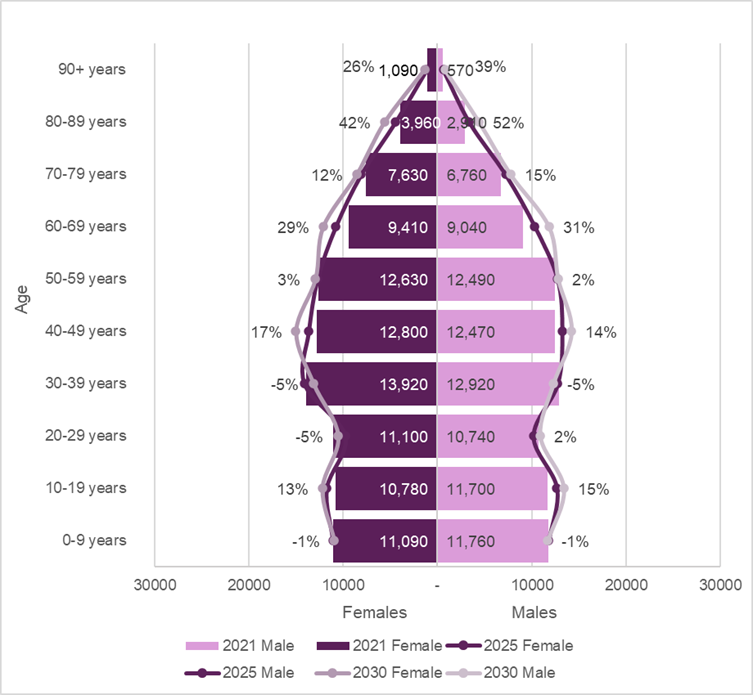
185,235 people from Bedford Borough completed the General Health question in the 2021 Census and there were around 29,800 people who characterised themselves as not being in good health. As expected, age was the most significant factor affecting people’s perception of health, with the proportion of people in Bedford Borough reporting good or very good health reducing from 97.4% for the youngest group (0 to 9 years) to 60.2% for the oldest (90 years and over).
It is forecast that the older age groups will grow fastest and therefore it can be expected that there will be an increasing number of people not in good or very good health over time.
Figure 1: Population pyramid for Bedford Borough 2021, 2025 and 2035
LOOKING FORWARD
Based on the local population forecasts, there are expected to be 36,600 people aged 65 to 84 and 7,000 people aged 85 and over by 2033, rising to 44,250 and 9,350 by 2043. If the proportions not in good health in 2021 continue, 17,200 in 2033 and 21,350 in 2043 could be expected not to be in good health.
General health perception in Bedford Borough compared
Age standardisation is a statistical method to do identify what is important beyond age. Using direct age standardisation, 82.7% of people reported good or very good health in Bedford Borough, 12.6 % fair health and 4.7% bad or very bad health, compared to 81.7% good or very good, 13.0% fair and 5.3% bad or very bad for England overall. This means significantly fewer people in Bedford Borough reported bad or very bad health than those in England, but also that significantly more females reported not being in good health in Bedford Borough than males.
Table 1: Directly age standardised general health Bedford Borough
| Sex | Very bad or bad health (%) | Fair health (%) | Good or very good health (%) | Very bad or bad health compared to England | Very bad or bad health compared to the other sex |
|---|---|---|---|---|---|
| Both | 4.7 | 12.6 | 82.7 | Significantly lower | N/A |
| Female | 5.0 | 12.8 | 82.2 | Significantly lower | Significantly higher |
| Male | 4.4 | 12.4 | 83.3 | Significantly lower | Significantly lower |
Beyond age and sex, significant inequalities were apparent based on deprivation, ethnicity, living situation, economic and employment status, and disability and caring responsibilities. To quantify these inequalities, indirect age standardisations were calculated. These provide ratios for each different characteristic compared to the population of Bedford Borough overall, which is scored at 100. A ratio higher than 100 indicates that the risk of having bad or very bad health in the population with a specific characteristic is higher than would be expected in the standard population of Bedford Borough and a ratio lower than 100 means that the risk is lower.
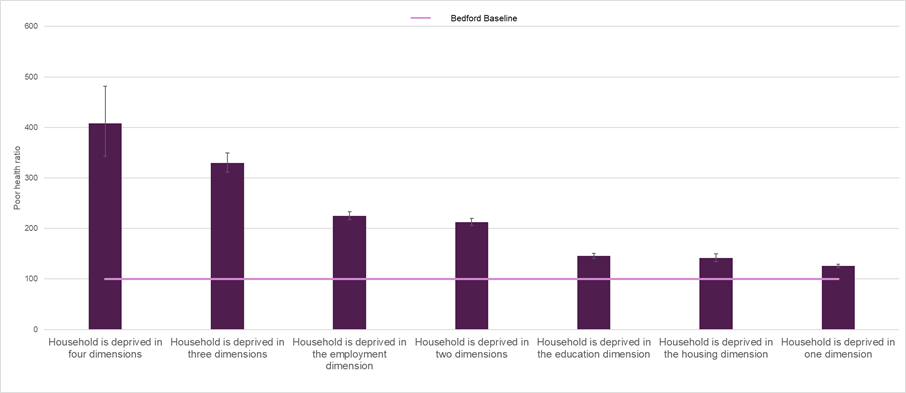
For example, males who lived in households with four dimensions of deprivation had a ratio of 408, meaning they were four times more likely to have bad or very bad health than the overall score for males in households in Bedford Borough.
The outcomes of this data analysis are presented in the Dashboard below. This is followed by an analysis of what it means for the people of Bedford now and projections of what could happen in the future based on the changes in population predicted in the Local population forecasts.
General health perception dashboard
Deprivation
Nationally, deprivation as measured by the Index of Multiple Deprivation (IMD 2025), is strongly correlated with healthy life expectancy.[1] This is reflected locally, where, over the three-year period from 2018 to 2020, there was a 16-year gap for males and a 10.6-year gap for females in healthy life expectancy between the most and least deprived wards in Bedford Borough.[2] (See the Demographics dashboard for more).
In the 2021 Census, deprivation was not based on the IMD but was calculated instead from other measures within the Census. For example, employment deprivation was identified if any member of a household, not a full-time student, was either unemployed, or economically inactive due to long-term sickness or disability. As the health dimension was calculated from the general health question as well as those who identified as disabled, this dimension is not included in this analysis.
In the 2021 Census data, the relationship between deprivation and perceived health remained strong. The more dimensions of deprivation that were apparent in a household, the greater the poor health ratio, with those deprived in all dimensions, 3.7 to 4.1 times more likely to have bad or very bad health, compared to the Bedford baseline. Of the individual dimensions, Employment deprivation was most associated with not being in good health, with a ratio of 230 for females and 225 for males.
Figure 2: Females in deprived households with significantly higher proportions of people reporting bad or very bad health
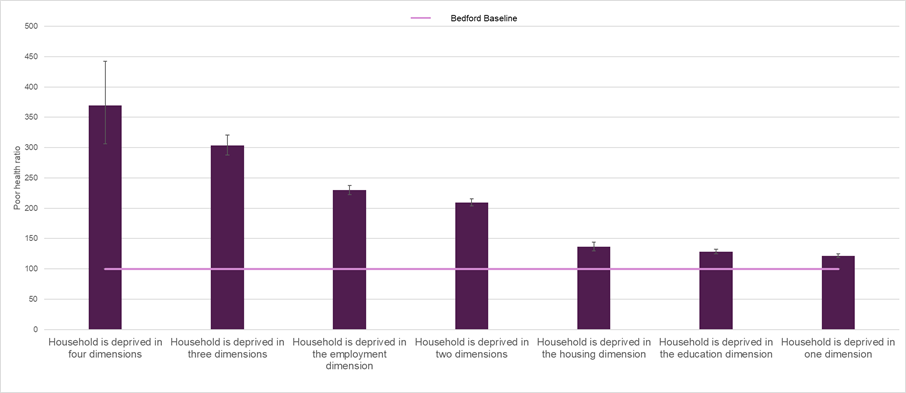
Figure 3: Males in deprived households with significantly higher proportions of people reporting bad or very bad health
Ethnicity, primary language and length of UK residence
Bedford Borough has a long history of ethnic diversity and trend data for the last twenty years show the population has become more ethnically diverse over time. Since 2001, the percentage of residents from ethnic minority groups has increased, while the percentage of White British residents has decreased. Similar trends are evident across the East of England and nationally, although the ethnic diversity is increasing at a faster rate in Bedford Borough than in these larger areas.
Figure 4: Population of Bedford Borough by ethnicity 2001-2021
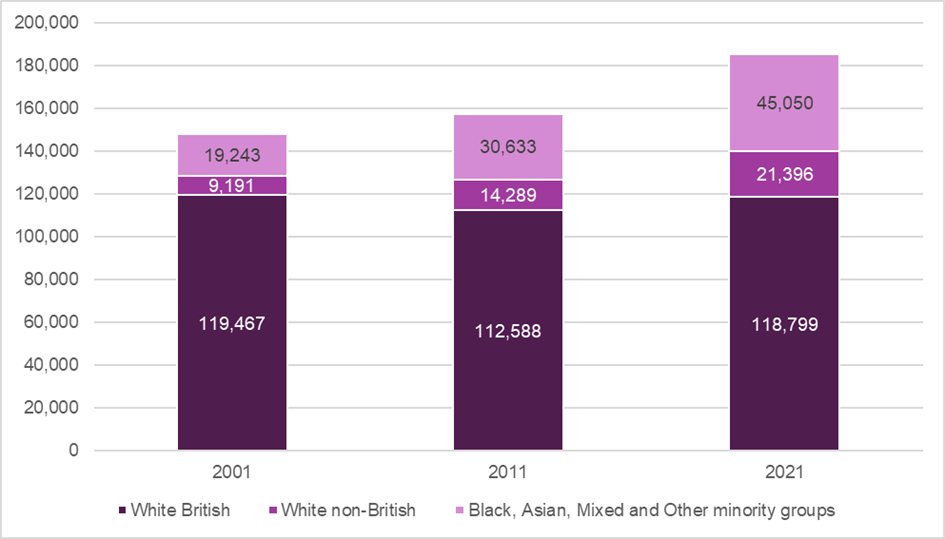
The percentage of Bedford Borough residents who are White reduced from 87% to 81% between 2001-2011, and then down to 76% in 2021. In addition, the ethnic diversity within the white group increased with the percentage of white people from places other than the UK increasing from 6% in 2001 to 9% in 2011, reaching 12% by 2021.
Across all ethnic minority groups other than White British (English, Northern Irish, Scottish, Welsh and British) 58% were born in the UK in 2021, compared to 45% in 2011.
The ethnic mix also changed between 2011 and 2021, with the Black, Black British, Black Welsh, Caribbean or African population increasing overall, driven by growth in the Black African population (+27%), while those of Caribbean heritage declined in number. The number of White Other (+22%) increased following growth in people coming from Eastern Europe, while the number of White Irish (-24%) and White British decreased overall.
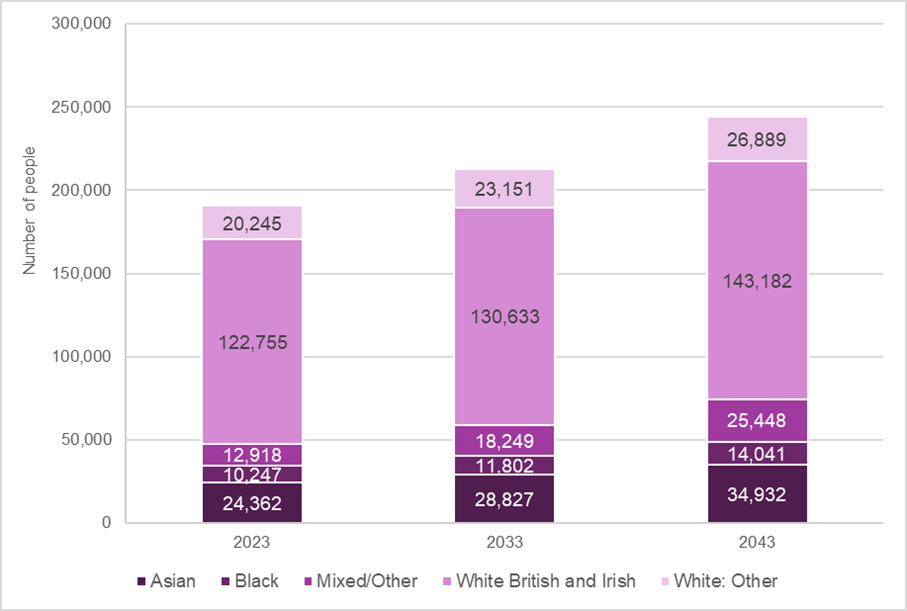
The ‘Any other ethnic group’ population saw the fastest growth, more than doubling in size (+145%) and also saw the sharpest rise across the East of England and nationally. This is not clearly defined but does include Afghans. Other groups to see high growth rates included: Arab (+57%); ‘Other mixed’ groups (+33%) and Bangladeshi (+25%), while ‘Other Black’ (-32%) and ‘Other Asian’ (-14%) declined in number.
These trends are expected to continue over the next two decades based on national migration.
Figure 5: Forecast of ethnicity population change 2023 to 2043
Being from an ethnic group other than White British does not correlate with lower healthy life expectancy. However, there are some specific ethnic groups that report higher proportions of people not in good health than others.
In Bedford Borough, people from the Gypsy and Irish Traveller communities had the highest poor health ratio among ethnic groups and therefore the poorest health when compared to Bedford overall. This is the case for both females and males with ratios approximately 2.5 times worse than the Bedford baseline.
Figure 6: Ethnic minority groups with significantly higher proportions of people not in good health by sex
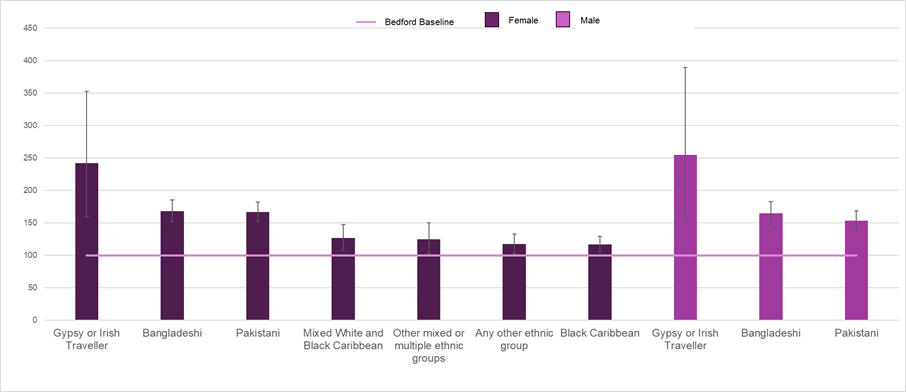
The number affected is small (under 50 were not in good health in 2021), however, it is very likely that the Census significantly underestimates the size of Gypsy and Traveller communities as many members do not complete the Census. It is also important to understand that these communities are distinct from the Roma community that was counted in the Census for the first time in 2021. By contrast, the proportion of females from the Roma community reporting bad or very bad health was similar to the Bedford average, while it was significantly lower for males.
Males and females from Bangladeshi and Pakistani ethnic groups also reported significantly higher proportions of bad or very bad health compared to Bedford overall. This was reinforced by analysis of main languages spoken. Bengali with Sylheti and Chatgaya are the major languages of Bangladesh and people who use these languages as their main language are over 1.8 times more likely to report bad or very bad health compared to the overall population of Bedford Borough. Urdu and Panjabi speakers, the main languages of Pakistani communities, also reported an increased proportion of people reporting bad or very bad health, with a ratio over 130.
The Bangladeshi population grew 25% between the 2011 and 2021 Censuses and even assuming no additional migration, there will be a considerable increase in the number of people from both Bangladeshi and Pakistani communities and therefore increases in the number of people in bad health could be expected.
LOOKING FORWARD
Based on the local forecasts of growth for ethnic groups in Bedford, there are expected to be around 1,200 Bangladeshi and Pakistani females and 1,000 males reporting bad or very bad health in 2033. The numbers are forecast to rise to approximately 1,500 and 1,300 respectively in 2043.
Among females, there are also significantly higher proportions of people reporting bad or very bad health with Black Caribbean, mixed White and Caribbean ethnicities, or other mixed or multiple ethnicities, as well as those that have ethnicities not specified. This unspecified population group saw the fastest growth, more than doubling in size (+145%) between 2011 and 2021. It also saw the sharpest rise across the East of England and nationally.
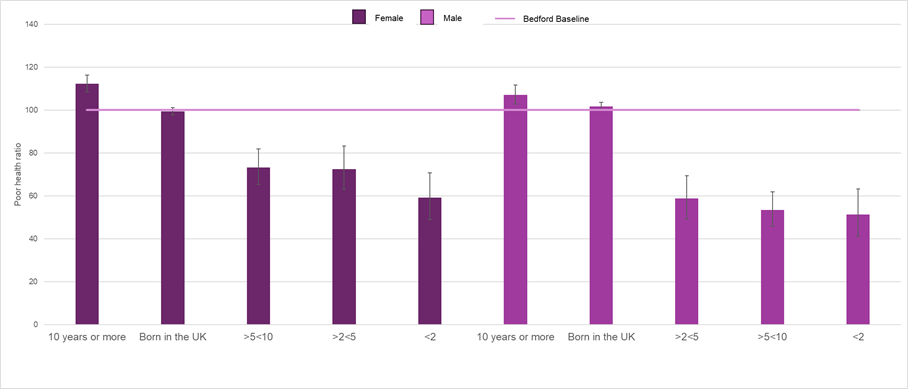
However, it is also noteworthy that only amongst those who had lived in the UK for ten years or more is the proportion of people reporting not good health significantly higher than the Bedford Borough baseline. This reflects that people coming to the UK are generally in good health..
Figure 7: Poor health ratio by length of residence in the UK and sex
Living situation
The way people live – the accommodation they live in, who they live with and their relationships – can all impact health and wellbeing.
Housing characteristics
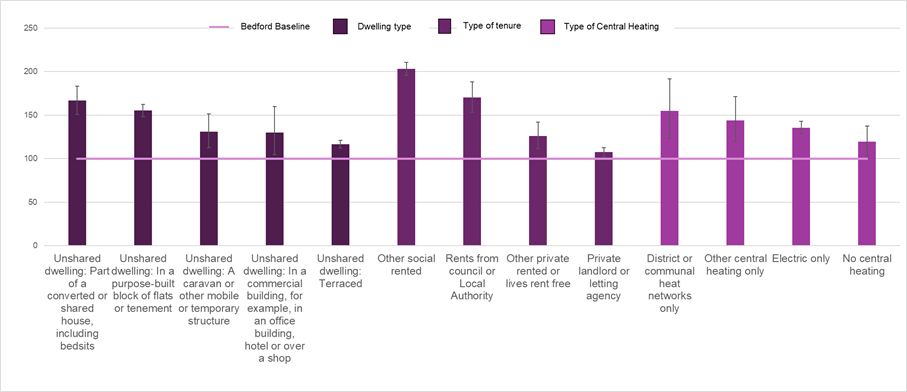
In Bedford Borough residents of dwellings that were part of a larger buildings, such as bedsits, flats, those who rent, and those with limited or no central heating, all reported higher proportions of people with bad and very bad health. Males who live in caravans or other temporary structures, were also more likely not to be in good health.
Approximately 60,400 people lived in the type of dwellings with higher proportions of people not in good health in 2021, of whom approximately 11,400 reported they were not in good health. This means that 19% of people living in these types of dwellings reported not being in good health, while around 39% of people not in good health lived in the type of dwellings with higher proportions of people not in good health.
The proportion of people who reported not being in good health also varied based on the way they pay for their homes, with those renting more likely to report poor health than those who own their own home. 64,100 people in Bedford Borough lived in rented accommodation in 2021, of whom 46% rented from the local authority or another form of social renting. In total 9,900 people living in rented accommodation were not in good health, which accounted for 40% of males and 30% of females not in good health.
26,500 people lived in buildings with heating systems associated with higher proportions of people not in good health. Of these, 5,150 reported not being in good health, which meant that 13.5% of males and 21.5% of females not in good health had heating systems that were associated with poorer health.
Projections aren’t possible as these numbers cannot be added together as many will live in accommodation with two or more of these features. For example, a person could live in a purpose-built block of flats, rented from the local authority which only had electric heating. However, it is still useful to see the housing characteristics associated with higher proportions of people not in good health as the numbers are considerable.
Figure 8: Characteristics of housing for which significantly more females report not good health
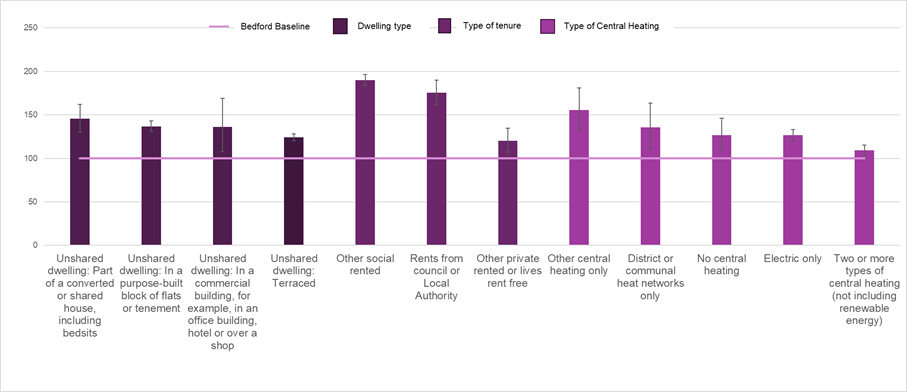
Figure 9: Characteristics of housing for which significantly more males report not good health
Overcrowded homes
Overcrowding is associated with poor health and lower educational attainment[3] and, in Bedford Borough, those who live in accommodation with more people than bedrooms reported significantly higher proportions of people not in good health, with ratios of 138 for females and 141 for males. Furthermore, those who live in accommodation that meets the formal definition for the correct number of bedrooms for the number of people*[4] also had a significantly higher proportion of people reporting not good health, with only a slightly lower ratio of 136 for females and 126 for males. In 2021, there were 67,000 living in accommodation with these occupancy ratings, although only 22% were of these were in homes with a rating suggesting they had fewer bedrooms than necessary. However, only those households with more bedrooms than required had a lower proportion of people reporting they were not in good health than the Bedford baseline. This suggests that the method of calculating the number of bedrooms required may not be adequate for health improvement purposes.
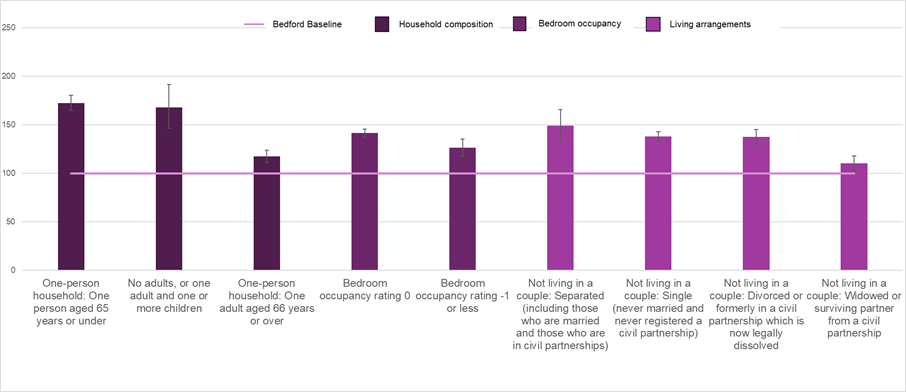
Figure 10: Characteristics of living conditions for which significantly more females report not good health
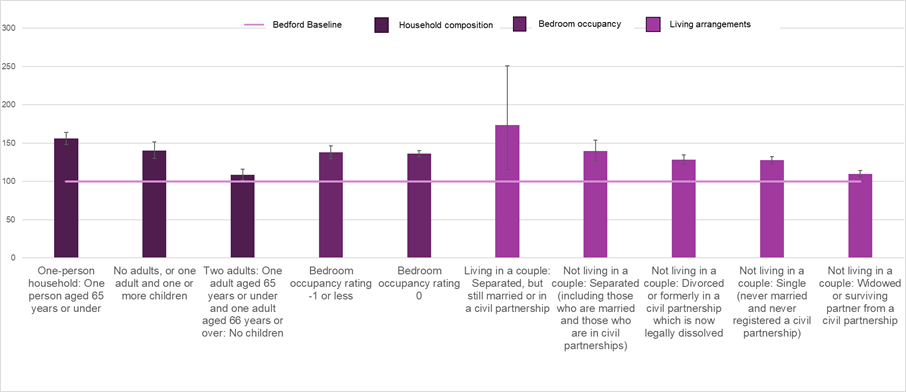
Figure 11: Characteristics of living conditions for which significantly more males report not good health
Social isolation
The close social relationships people have can impact on their physical and mental health. Loneliness is particularly associated with increasing mortality and a higher risk of some cardiovascular, metabolic and neurological disorders as well as poor mental health.[5] A striking feature brought out by the analysis of the General Health question in the 2021 Census was the relationship between higher proportions of people reporting they were not in good health and those living in single adult households. For both males and females, a significantly higher proportion of people not living in a couple (with the exception of those married or in a registered civil partnership but not living together) reported not being in good health. The highest ratio for both sexes was for those who were separated (150 for men and 140 for women), and the lowest among people living along was for those widowed (110 for both sexes).
A total of 57,200 adults (aged 16 years and over) were not living in a couple in Bedford Borough in 2021, of which 13,300 reported not being in good health. Adults not living in a couple accounted for 52% of females and 42% males not in good health.
There is a similar pattern for single person and single parent households across both sexes, for those aged 65 and under. However, for older people, men living alone have a higher ratio, while it is women living in a couple in which one partner is under and the other older than 65 years, that have a higher ratio, which may suggest a carer relationship exists.
LOOKING FORWARD
If the 2021 proportions were applied to the forecast population, there would be 68,300 adults not living in a couple in 2033, rising to 78,800 in 2043. Of these 14,400 in 2033 and 16,600 in 2043 could be expected not to be in good health.
Disability and unpaid caring
The percentage of people providing unpaid care decreased in Bedford Borough between 2011 and 2021, however, the number of people living longer with long term conditions is increasing and therefore so is the demand for care. Unpaid carers – family, friends and volunteers – make a considerable contribution to meeting this need. However, it can also impact on the health of the carers.
For both males and females who provided 20 hours or more of unpaid care, the poor health ratio for unpaid carers was significantly above the baseline for Bedford Borough. Surprisingly, it was not the group of people who provided the most hours of care that had the highest proportion of people reporting not being in good health, but rather those who provided 20 to 49 hours. Females had a ratio of 165 and males 140, whereas for those providing over 50 hours care a week the ratios were 141 and 129 respectively. This is despite there being more people providing over 50 hours care. However, it might reflect additional emotional, physical and financial hardships faced by people providing 20 to 49 hours care having other responsibilities, such as employment and childcare while providing significant levels of care. However, the picture was more positive for those providing up to 19 hours of care, with females having a ratio significantly lower than the baseline (91) and males a similar ratio to the baseline (96).
In 2021, there were a total of 14,324 people who identified themselves as providing unpaid care. This compares to just under 2,000[6] who were receiving Carers Allowance in the quarter ending August 2021 (the period when the Census took place). Of the people identified as unpaid carers in the Census 3,582 reported they were not in good health, again suggesting a gap between need and the support being received.
LOOKING FORWARD
If the 2021 proportions were applied to the forecast population, there would be 17,500 people providing unpaid care in 2033, rising to 20,100 in 2043. Of these 4,400 in 2033 and 5,000 in 2043 could be expected not to be in good health.
Figure 12: Characteristics of disability and unpaid caring and poor health ratios for females
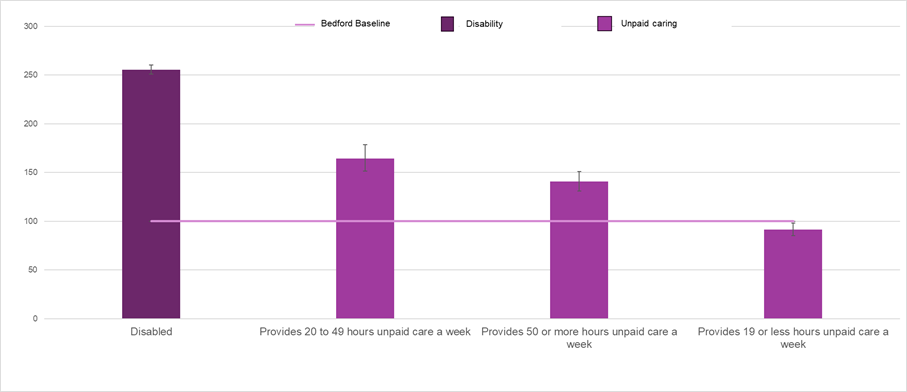
Figure 13: Characteristics of disability and unpaid caring and poor health ratios for males
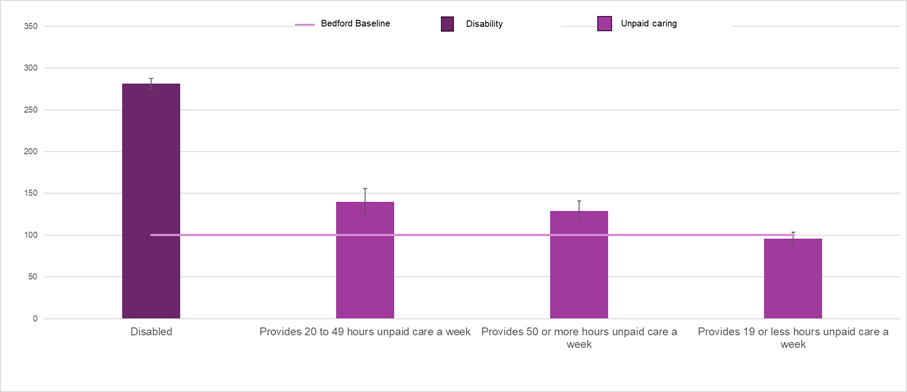
Females who identified themselves as being disabled in the Census were approximately 2.5 times more likely to report not being in good health than the Bedford baseline, while males were 2.8 times more likely. Two thirds of all the people who reported that they were not in good health in 2021 were also disabled. In 2021, there were 28,725 people considered disabled under the Disability Act. This number has been rising and is expected to continue doing so.
LOOKING FORWARD
If the 2021 proportions were applied to the forecast population, there would be 33,000 disabled people in 2033, rising to 38,000 in 2043. Of these 22,000 in 2033 and 25,000 in 2043 could be expected not to be in good health.
Where people with poorer perceived health live
Just as there are differences in how people with different characteristics perceive their health, so are there differences based on where they live.
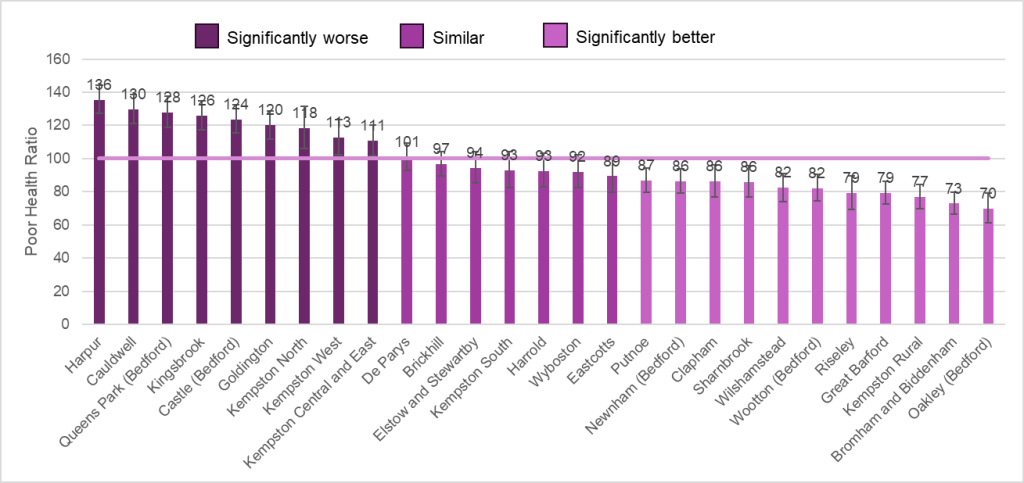
Generally, areas closer to the centre of Bedford Town have higher proportions of people who perceive themselves not to be in good health, while those areas in the west and north have the lowest proportions.
Figure 14: Poor health ratio for females by ward
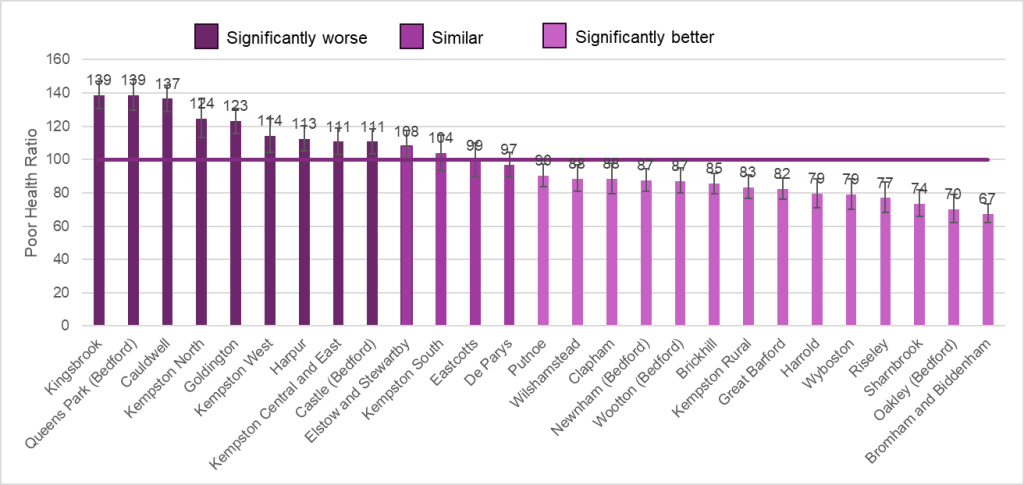
The same nine wards have significantly worse ratios for males and females, however they are in a different order, with Harpur having the highest proportion of males reporting not good health, whereas it is Kingsbrook for females. There are also more wards (14) with a significantly lower proportion of females reporting not good health, than males (11).
Figure 15: Poor health ratio for males by ward
Economic activity, employment and education
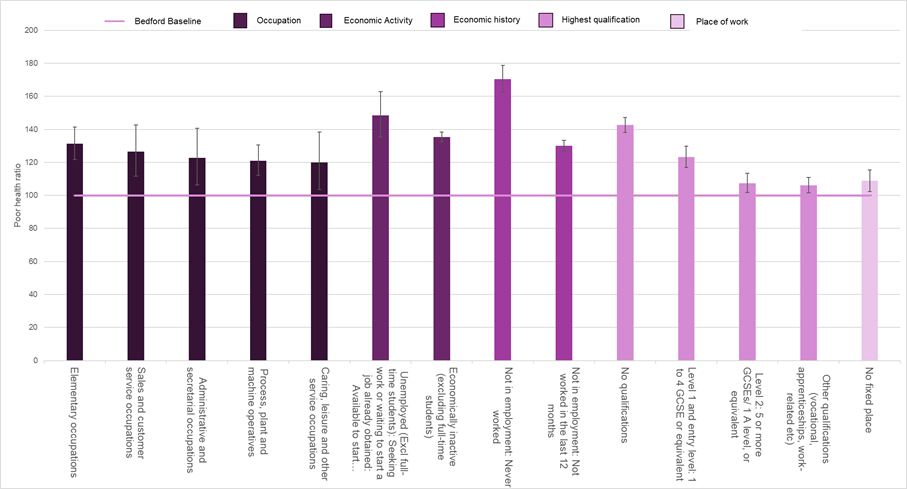
Across sexes, there is a noticeable relationship between general health and economic activity, and the type of work undertaken is particularly important. Males not in employment and who have never worked were 1.7 times more likely not to be in good health in 2021 than the Bedford baseline. For females, the ratio was slightly less; they were 1.6 times more likely not to be in good health. In 2021, there were 13,800 people in Bedford who had never worked of whom 4,530 reported they were not in good health.
Significantly more people who were economically inactive reported bad or very bad health. For those who in work, there is a positive relationship between managerial, administrative and professional occupations and good health, while there is a negative relationship for others. Both males and females in elementary occupations, sales and customer service occupations, and caring, leisure and other service occupations are all more likely to not be in good health. Males who are process, plant or machine operatives, or in administrative or secretarial occupations, also have a higher poor health ratio compared to the Bedford baseline. These jobs often require fewer and lower qualifications and the relationship between qualifications and not being in good health follows a similar pattern to occupation. The group with no qualifications has a higher proportion of people not in good health than those with higher levels of qualification.
Finally, not having a permanent place of work is also associated with a higher proportion of people not in good health. Over 12,000 working people had no fixed location for work in 2021, 80% of whom were male. The ratio was closer to the Bedford baseline for men (109), compared to 133 for women, but both were significantly higher.
Figure 16: Characteristics of employment, economic activity and education for which significantly more females report not good health.
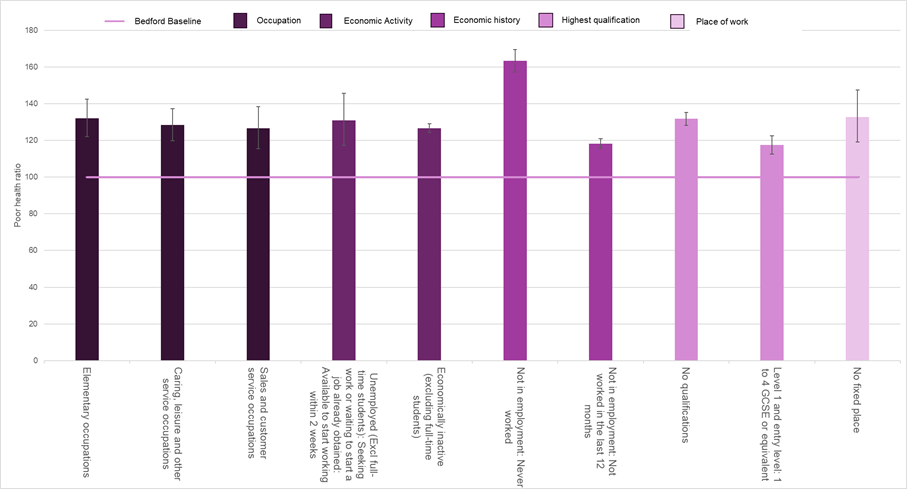
Figure 17: Characteristics of employment, economic activity and education for which significantly more males report not good health.
LOOKING FORWARD
If the 2021 proportions were applied to the forecast population, there would be 15,850 people who had never worked in 2033, rising to 18,200 in 2043. Of these 5,200 in 2033 and 6,000 in 2043 could be expected not to be in good health.
Document download
Download a PDF version of this report below. This includes all the content in this report except the PowerBI dashboard.
Bedford-Borough-2021-Census-Gen-Health-report-2026Notes and references
[1] Male R2 = 0.68; Female R2 = 0.65. https://fingertips.phe.org.uk/indicator-list/view/612WCOn3ZU#page/10/gid/1938133452/pat/15/par/E92000001/ati/502/are/E09000002/iid/94240/age/1/sex/4/cat/-1/ctp/-1/yrr/1/iid2/90362/age2/1/sex2/2/cat2/-1/ctp2/-1/yrr2/3/cid/4/tbm/1
[2] https://bedford.jsna.uk/jsna/population-place/demographic-dashboard/
[3] Goux DM, Maurin E. The effect of overcrowded housing on children’s performance at school. Journal of Public Economics 2005;89(5):797–819.
[4] The number of bedrooms the household requires is calculated according to the Bedroom Standard, where the following should have their own bedroom: 1. adult couple 2. any remaining adult (aged 21 years or over) 3. two males (aged 10 to 20 years) 4. one male (aged 10 to 20 years) and one male (aged 9 years or under), if there are an odd number of males aged 10-20 5. one male aged 10-20 if there are no males aged 0-9 to pair with him. 6. repeat steps 3-5 for females 7. two children (aged 9 years or under) regardless of sex 8. any remaining child (aged 9 years or under) An occupancy rating of: * -1 or less implies that a household’s accommodation has fewer bedrooms than required (overcrowded) * +1 or more implies that a household’s accommodation has more bedrooms than required (under-occupied) * 0 suggests that a household’s accommodation has an ideal number of bedrooms.
[5] Hawkley, L.C. Loneliness and health. Nat Rev Dis Primers 8, 22 (2022). https://doi.org/10.1038/s41572-022-00355-9
[6] Local Authority StatXplore CA in Payment